
In previous installments of this series, we explored what CAN Bus is, how to set up your first network, and how to interpret CAN frames. Now it’s time to put that knowledge to work by actually capturing and debugging real CAN traffic.
Whether you’re diagnosing an intermittent fault, reverse engineering a message, or validating your system during development, being able to record, filter, and analyze CAN data in real time is essential.
In this post, we’ll look at:
- How to set up ATI CANLab for efficient capture and debugging
- How CANLab’s features compare to popular free tools
- How engineers use CAN capture in real-world validation and testing
Setting Up ATI CANLab for CAN Capture
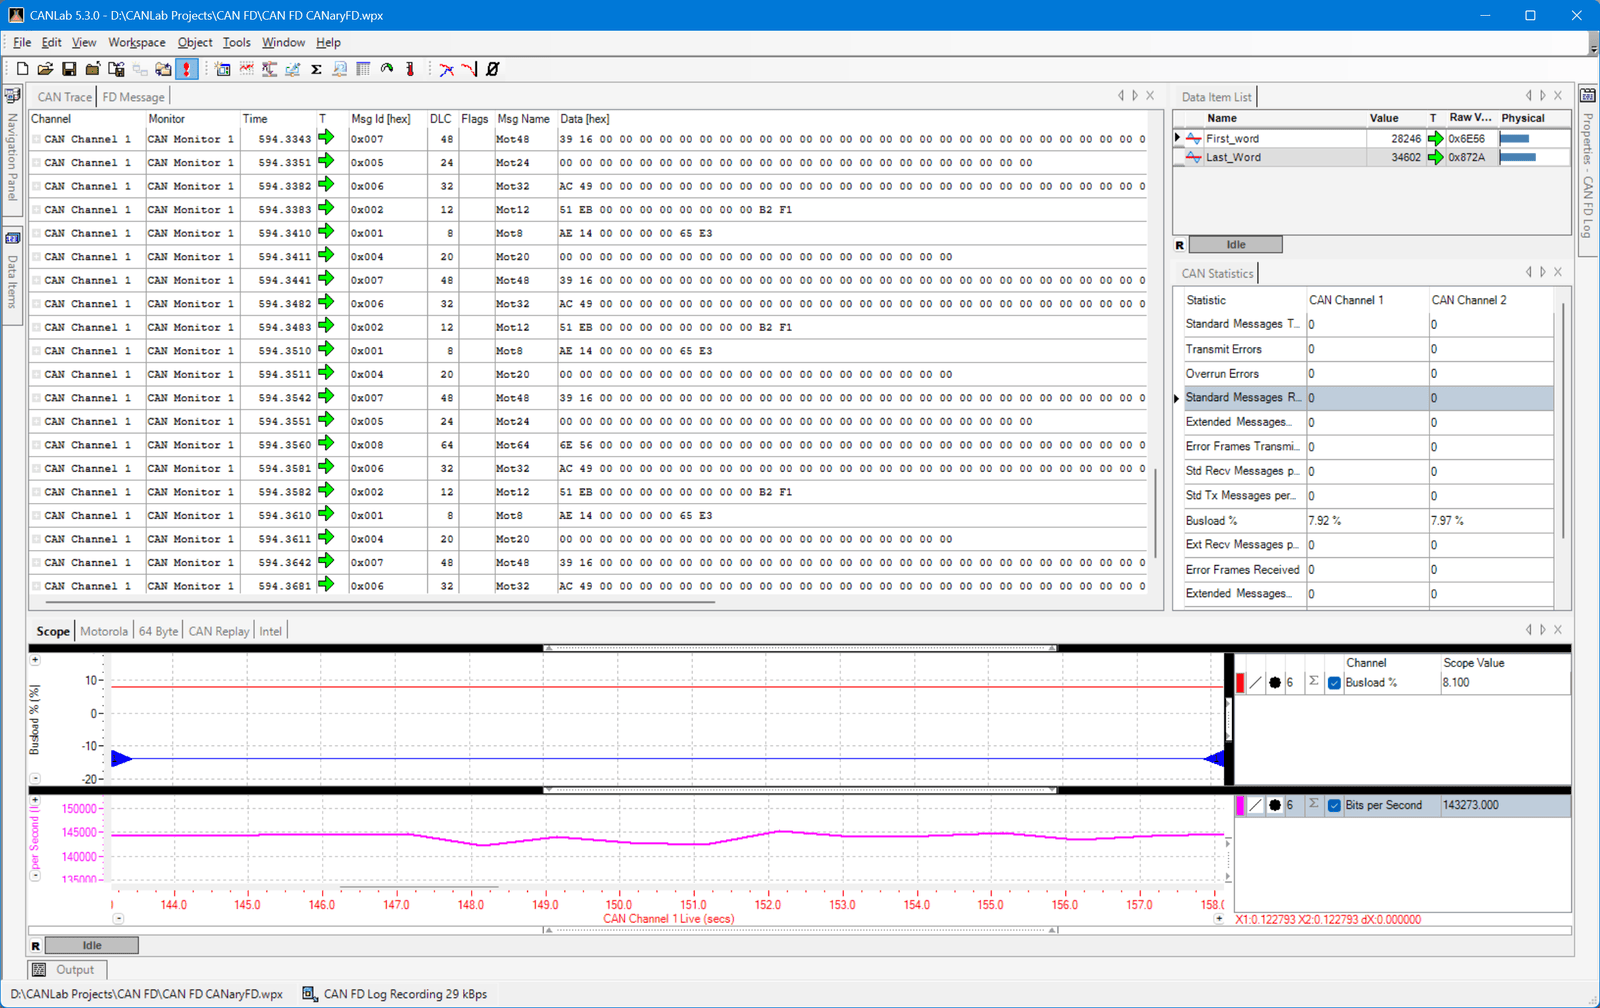
ATI CANLab is designed for professional-grade capture, filtering, and analysis. Once your ATI CAN interface (such as a CANary, CANary FD) is connected to your PC and the CAN Bus, setup is straightforward:
- Select Your Hardware
In CANLab, add your interface in the Channel Manager. This can be done manually or CANLab can automatically detect supported devices. - Configure Bus Parameters
Set the CAN frame type (Classic CAN or CAN FD). Set the bit rate(s) to match the connected network. - Create a Capture Workspace
Organize your capture view with multiple panes, such as a live message list, graphical plots, and a message decode view—so you can see data in different forms simultaneously.
Filtering and Triggering for Efficient Debugging
Capturing everything on a busy CAN Bus can be overwhelming. CANLab’s filtering tools help you focus only on the data you need:
- ID-Based Filters
ID Filters can be used with Message Loggers and the CAN Trace window to focus on the messages of interest. There are separate lists for 11-bit and 29-bit identifiers. - Message Highlighting
Change the display formatting in the CAN trace window based on Message ID or the value of a signal in the message. - Event Triggers
Set CANLab to begin capture based on a message or value appears on the bus. This is especially useful when trying to capture intermittent issues.
How CANLab Compares to Free Tools
There are popular free options like SavvyCAN and Wireshark with SocketCAN. These tools are excellent for hobbyists or quick one-off captures, but they have limitations compared to CANLab:
| Feature | CANLab | SavvyCAN | Wireshark + SocketCAN |
|---|---|---|---|
| Real-time signal decoding | Built-in CAN DBC support | Partial (manual mapping) | Partial (requires external configs) |
| Multi-bus synchronized capture | Native | Limited | Limited |
| Trigger and filter granularity | Highly configurable | Moderate | Basic |
| Long-term reliability | Designed for continuous test logging | Varies by platform | Dependent on OS stability |
If your work involves production vehicle testing, ECU calibration, or compliance validation, CANLab’s advanced features save time and prevent missed data.
How Engineers Use CAN Capture in Development and Testing
In real-world engineering workflows, CAN capture and debugging is critical at multiple stages:
- Early Development
Verifying that an ECU is broadcasting the expected messages and signal values. - Integration Testing
Confirming that different ECUs exchange data correctly without ID conflicts or unexpected delays. - Issue Reproduction
Capturing the exact sequence of messages leading up to a fault so it can be analyzed later. - Regression Testing
Comparing CAN logs from different software versions to ensure no unintended changes were introduced.
With CANLab, these tasks are streamlined by time-aligned multi-bus capture, automatic decoding, and easy export for team collaboration.
Wrapping Up
Capturing and debugging CAN traffic is where theory meets reality. Whether you’re troubleshooting a stubborn fault, validating an ECU during development, or ensuring network integrity before production, the right tools make the difference between chasing ghosts and finding answers.
Free tools can get you started, but ATI CANLab delivers the precision, flexibility, and reliability that professional workflows demand, especially when your test data needs to be accurate the first time, every time.
In the next installment, we’ll take this knowledge on the road and look at sniffing a vehicle’s OBD-II network, covering passive monitoring, safe connection practices, and real-world logging techniques.